
Report Summary
The City of San Diego adopted its Vision Zero commitment in 2015, pledging to eliminate traffic fatalities and serious injuries by 2025. The data in this report is an account of the progress towards Vision Zero at the half-way point of the City of San Diego’s 10-year goal.
This report contains data on traffic fatalities and serious injuries from 2013 through 2020 in the City of San Diego. The data shows that while the combined number of traffic fatalities and serious injuries rose between 2013 and 2018, it declined in 2019 and again in 2020.
Traffic fatalities and serious injuries in San Diego increased between 2013 and 2018, particularly for pedestrians. This reflects a national trend of increasing pedestrian traffic fatalities. In 2019, there was a modest decrease in the City of San Diego for combined serious injuries and fatalities compared to 2018. 2020 showed a further decline in the City of San Diego, compared to 2019. While data from 2020 is likely to be an outlier due to the COVID-19 pandemic, the data from recent years give reason for optimism that San Diego may be turning a corner for Vision Zero.
While the City of San Diego’s efforts have shown modest success, more must be done to achieve the goal of eliminating traffic fatalities and serious injuries by 2025.
Press
- San Diego's Vision Zero Initiative So Far Has ‘Modest Success' in Decreasing Traffic Deaths, Injuries: Report, NBC 7, May 12, 2021
- Circulate San Diego San Diego Making “Modest But Real” Gains on Vision Zero Goal, Streetsblog, May 12, 2021
- ‘Vision Zero’ Street Safety Advocates Cite 2-Year Trend of Declining Fatalities and Serious Injuries, Times of San Diego, May 16, 2021
- Opinion: San Diego’s Streets Should Be Safe for Everyone — Not Just Cars, Times of San Diego, April 15, 2022
Hope for Vision Zero
Executive Summary
The City of San Diego adopted its Vision Zero commitment in 2015, pledging to eliminate traffic fatalities and serious injuries by 2025. The data in this report is an account of the progress towards Vision Zero at the half-way point of the City of San Diego’s 10-year goal.
This report contains data on traffic fatalities and serious injuries from 2013 through 2020 in the City of San Diego. The data shows that while traffic fatalities and serious injuries rose between 2013 and 2018, they declined in 2019 and again in 2020.
Traffic fatalities and serious injuries in San Diego increased between 2013 and 2018, particularly for pedestrians. This reflects a national trend of increasing pedestrian traffic fatalities. In 2019, there was a modest decrease in the City of San Diego for serious injuries and fatalities compared to 2018. 2020 showed a further decline in the City of San Diego, compared to 2019. While data from 2020 is likely to be an outlier due to the COVID-19 pandemic, the data from recent years give reason for optimism that San Diego may be turning a corner for Vision Zero.
While the City of San Diego’s efforts have shown modest success, more must be done to achieve the goal of eliminating traffic fatalities and serious injuries by 2025.
Moreover, the dataset shared with Circulate San Diego contained minor internal inconsistencies, as well as some inconsistencies with traffic collision data published by the City’s open data portal. To follow its own data-driven Vision Zero commitment, The City of San Diego must improve how it tracks and maintains traffic collision data.
Rise in Pedestrian Fatalities

From 2009 to 2018, pedestrian fatalities in the United States increased 53 percent, from 4,109 in 2009 to 6,238 in 2018.[1] By comparison, the combined number of all other traffic fatalities increased by only two percent.[2] A variety of explanations have been posed for this dramatic rise in pedestrian fatalities. Among them are:
- A shift from passenger cars to light trucks and SUVs, which are more dangerous to pedestrians;
- An increase in economic growth leading to an increase in vehicle miles travelled;
- Warmer weather leading to an increase in pedestrian activity;
- The growth in use of smartphones leading to an increase in distracted driving.[3]
One interesting finding is that while nighttime pedestrian fatalities increased by 67 percent nationally from 2009-2018, daytime pedestrian fatalities increased by just 16 percent during the same period.[4] This growth suggests a need to prioritize improvements that increase safety at night.[5]
There is some cause for optimism: estimates indicate that 2019 had one percent fewer pedestrian fatalities than 2018, and preliminary data for 2020 shows a slight reduction from 2019.[6] This means that 2018 was a peak year for pedestrian fatalities, with the highest number since 1990.[7]
The Coronavirus pandemic resulted in a drastic reduction in traffic, but traffic fatalities actually increased nationally. According to NHTSA’s analysis of the first nine months of 2020, traffic fatalities were up 4.6 percent, even as vehicle miles travelled were down 14.5 percent.[8] This represents an increase in fatality rate per 100 million vehicle miles travelled from 1.10 to 1.35, as compared to the first nine months of 2019.[9] This may be caused by reckless driving behaviors due to emptier streets. In April 2020, the California Highway Patrol reported an 87 percent increase in citations for speeding in excess of 100 mph.[10] That trend continued through the fall.[11]
The risk of being killed in a crash is not borne equally by all pedestrians. People of color, people over 50, and people walking in communities with lower median household incomes are disproportionately killed while walking.[12] African Americans, American Indians, and Alaska Natives face particularly high risks.[13] Preventing pedestrian fatalities requires particular focus on communities disproportionately harmed by traffic collisions.
San Diego’s Data

Pedestrian fatalities in California are particularly bad. In 2018, California had the eleventh
highest rate of pedestrian fatalities in the nation, at 2.3 fatalities per 100,000 population.[14] The rate in San Diego was higher, at 3.09.[15] The rate in San Diego was also higher than Los Angeles, which had a fatality rate of 2.93.[16] Both Los Angeles and San Diego were significantly more dangerous for pedestrians than Northern California cities. San Francisco’s pedestrian fatality rate was 1.58, while San Jose’s was 2.14.[17] Among United States cities with populations of 500,000 or greater, Seattle had the lowest pedestrian fatality rate at 1.07, and Phoenix had the highest at 6.63.[18]

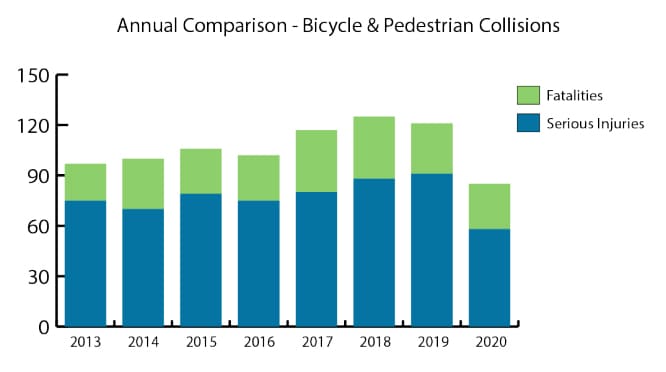
Data collected and analyzed by Circulate San Diego through public information requests to the San Diego Police Department show that fatalities and serious injuries among pedestrians and bicyclists increased 29 percent from 2013 to 2018. While this increase is severe, it is less than the national increase in pedestrian fatalities of 53 percent (national data focuses on pedestrian fatalities and is unavailable for serious injuries).[19] In 2013, San Diego had 22 fatalities and 75 serious injuries among bicyclists and pedestrians, while in 2018, there were 37 fatalities and 88 injuries. This is a 68 percent increase in fatalities, a 17 percent increase in serious injuries, and a 29 percent increase overall.
From 2018-2019, pedestrian and bicycle fatalities decreased 19 percent to 30 fatalities, and serious injuries increased three percent to 86 serious injuries. , which
is greater than the national decline in pedestrian fatalities of one percent for the same period.[20]
In 2020, the pandemic resulted in a steep decline in pedestrian and bicycle fatalities and serious injuries San Diego. Despite the decline in severe injuries and fatalities, harm to bicyclists and pedestrians remained unacceptably high, with 27 bicycle and pedestrian fatalities and 58 serious injuries.

Decreases in 2019 and 2020 are cause for optimism that it is possible for San Diego’s rate of pedestrian and bicycle injuries and fatalities to decline. However, that optimism should be tempered by caution. The data for 2020 is likely an outlier because of the COVID-19 pandemic. Moreover, although 2019 was less dangerous than 2018, it was still the second most dangerous year between 2013 and 2020.
San Diego’s traffic injuries and fatalities present serious equity concerns. An analysis by the City of San Diego determined that from 2008-2012, pedestrian collision rates were ten times higher in low-income census tracts than they were in high-income census tracts.[21] Reexamining this finding for subsequent years is beyond the scope of this analysis, but it is likely that this trend persists. Although the City’s analysis considered a variety of trends and demographic factors, it did not consider race.[22] Nevertheless, it is likely that people of color in San Diego are at higher risk of being killed while walking given national trends,[23] wealth inequity, and historical disinvestment of communities of color. The data provided to Circulate does not include race of victims.

While the data used in this report is the best information available, it is not perfect. Data obtained by Circulate San Diego did not always clarify the number of fatalities or serious injuries in a single incident. Collision data published by the City through its open data portal[24] omits some information from the dataset produced to Circulate, and the dataset produced to Circulate is missing some information included through the City's open data portal. Circulate San Diego staff did not attempt to reconcile these two datasets. Circulate San Diego staff did count the number of fatalities and serious injuries in each incident, reclassify crash type where appropriate, and remove crashes that occurred outside the City of San Diego. Where crash descriptions were ambiguous or confusing, Circulate San Diego staff was sometimes able to obtain more information through news articles regarding the crash. [24] These adjustments to San Diego’s data are noted in the electronic appendix published with this report.
Vision Zero requires the City of San Diego to use data to prioritize interventions that will lead to the most reduction in human harms. While the existing datasets are useful, achieving Vision Zero will require better collection and accuracy for traffic collision data.

San Diego’s Progress
San Diego’s investment in Vision Zero has been substantial, but it is not sufficient if San Diego is to reach its goal of eliminating serious injuries and fatalities by 2025. By the end of fiscal year 2021, the City of San Diego will have invested $146.3 million in Vision Zero improvements.[25] These investments include sidewalks, bikeways, new signals, signal modifications, streetlights, traffic calming measures, and median installations.[26]
In 2017, Circulate San Diego identified the “Fatal 15”, the 15 most dangerous intersections in the City of San Diego, and campaigned for the City to fix them.[27] Improvements to those intersections, which included high visibility crosswalks, audible pedestrian signals, and countdown timers, were finished in February 2019.[28] In January 2019, then-Mayor Kevin Faulconer committed to improve nearly 300 intersections throughout San Diego.[29] Those improvements, which would include pedestrian countdown timers and high visibility crosswalks, were slated to begin construction in summer 2020.[30]
San Diego’s Vision Zero strategic plan lays out the actions that the City of San Diego will pursue from 2020 to 2030.[31] The plan calls for annually constructing 25 new or improved pedestrian crossings, 40 miles of new or improved bikeway, and repairing or constructing at least two miles of sidewalk.[32] Other street safety plans identified include equity investments, planning corridor studies, roundabouts, and speed reductions.[33]

Conclusion
Recent declines in the numbers of traffic fatalities and serious injuries in the City of San Diego give reason for optimism. Efforts appear to be bearing fruit, and making our streets modestly more safe. Still, San Diego is not on track to achieve its goal of achieving zero traffic fatalities and fatalities by 2025. To continue the momentum of the last two years, the City of San Diego must redouble its efforts, and make street safety, and Vision Zero a top priority.
Furthermore, the City should strive to improve the quality of its data collection so that it can accurately assess its Vision Zero efforts.
